- Trello
- Kanban Tool
- Kissflow Project
- Airtable
- Asana
- Clarizen
- Zoho Projects
- Wrike

Operations Management - Basic Decision Making Tools
Cost-benefit analysis is used to see if an investment is worth pursuing. You are measuring the benefits expected from a decision, measuring the costs associated with this decision, and then see if the benefits outweigh the costs. Most businesses have both fixed costs and variable costs. Fixed costs remain the same no matter how much the company makes or sells. Some examples would be the rent on a building, the insurance, exempt salaries, or the lease of a copy machine. Variable costs change with the company’s production and sales volume of a unit. Some examples would be the cost of materials, delivery costs, compensation of the sales team, salaries of non-exempt workers, or the cost of paper and ink of a copy machine. If the benefits outweigh the costs based on analytical data, then you could go ahead with the planned course of action. A good tool to use would be:
- Break-even analysis. It lets you find when you first start making profit. If we were to base this on a product being sold, the formula would be: units sold = the fixed costs ÷ (the selling price minus the variable cost per unit).
A simple example would be if a copy machine is leased for $8,000 per year (which is the fixed cost) and you sell the copy for 10¢ (Selling price) but it costs 3¢ for the paper and ink per copy (the variable cost), the result would be:
$8,000 ÷ ($0.10 - $0.03) or $8,000 ÷ $0.07 which would equal 114,285 copies needed to be sold to break-even. That would be the point in which the machine paid for itself, the break-even point, and from that point on is when you would see profit.
If you are looking at two comparable pieces of equipment, you can use:
- Crossover Analysis. This lets you identify the point where you should switch from one product or service to another one that has similar benefits, but different fixed and variable costs. Using the same copy machine example, which we will call machine 1, and machine 2 that costs $4,000 with variable costs of 5¢ a copy, the formula would be: Crossover units = (machine 2’s fixed cost – machine 1’s fixed cost) ÷ (machine 1’s variable cost – machine 2’s fixed cost). The result would be:
Crossover units = (4,000 - 8,000) ÷ (.03 - .05) or (-4,000) ÷ (-0.02) which would equal 200,000. This means that at 200,000 copies, the total cost of each of the two machines is equal. If you expect to sell more than 200,000 copies then machine 1 would be the best choice. If you expect to sell less than 200,000 copies then machine 2 would be the best choice.
Another example of cost-benefit analysis:
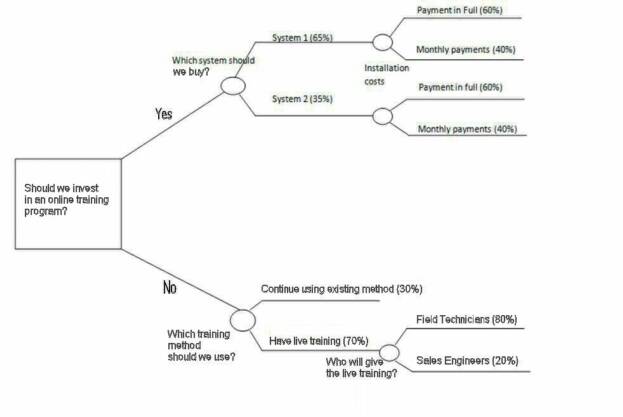
The customer operations manager is deciding whether to implement a new online training program that would cover approximately 33% of the current live based training. There is no budget to hire someone for this job specifically, so a decision needs to be made whether it is worth using an existing staff member to work on this project. A new more robust computer and training software will need to be purchased. Sales and Support will need to be trained as well as the existing customer base. Some production work will be lost due to pulling one person off of their normal duties to work on this project. Some of the work will also be outsourced.
Here is the cost-benefit analysis used to determine if the project is worth pursuing:
Costs:
Online training setup:
- Software for interactive training is $1,000
- 1 new PC dedicated to project is $2,000
- Web page and hosting setup (outsourced) is $10,000
Internal Training costs:
- Training introduction to sales and support of 10 people is $500 each for a total of $5,000
- Training introduction to the customer base of 4 people is $500 each for a total of $2,000
Other costs:
- Lost time: 1 Person for 6 months is $30,000
- Lost production through disruption: estimated $50,000
- Lost time for weekly meetings with key staff throughout project: estimated $10,000
Total cost: $110,000
Benefits:
- Reducing one day of live based training (hotel, training room, etc): estimated $25,000 per year
- Improved training efficiency, resulting in fewer support calls, thus eliminating need to hire additional support staff: estimated $80,000 per year
- Improved retention based on further understanding of product: estimated $40,000 per year
Total Benefit: $145,000 per year
The Break-even point would be $110,000 ÷ $145,000 = 0.76 of a year or approximately 9 months.
With this analysis, a decision based on facts, not just speculation, can be made. If needed, this cost-benefit analysis can be given to upper management to evaluate.
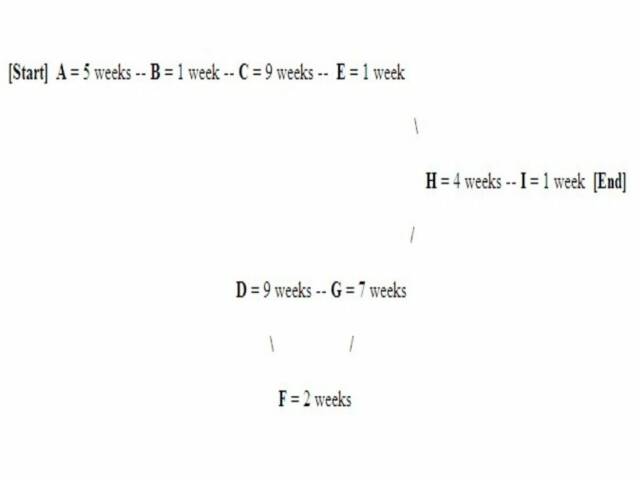
Critical Path Method (CPM) will help you plan and coordinate the tasks and activities in a project. CPM analysis requires that you first determine all of the steps necessary to complete the project. You then prioritize based on the steps that are dependent on others steps being completed first, as well as those that can run parallel to other tasks. It is one of the basic tools to use in Project Management. Project Management is the planning, organizing and managing of allocated resources to bring about the successful completion of a specific project.
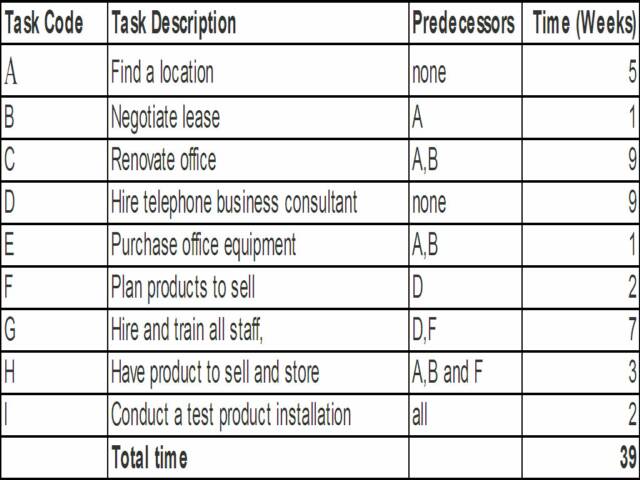
Lets say you are planning on opening a telephone installation business and already know the main tasks needed to get started. You would assign a code based on each task and put them in order. The order would consist of the task that needs to be done before you can do the next one (predecessor), and how long you think each task will take.


 | ||||